Download A4Medicine Mobile App
Empower Your RCGP AKT Journey: Master the MCQs with Us!

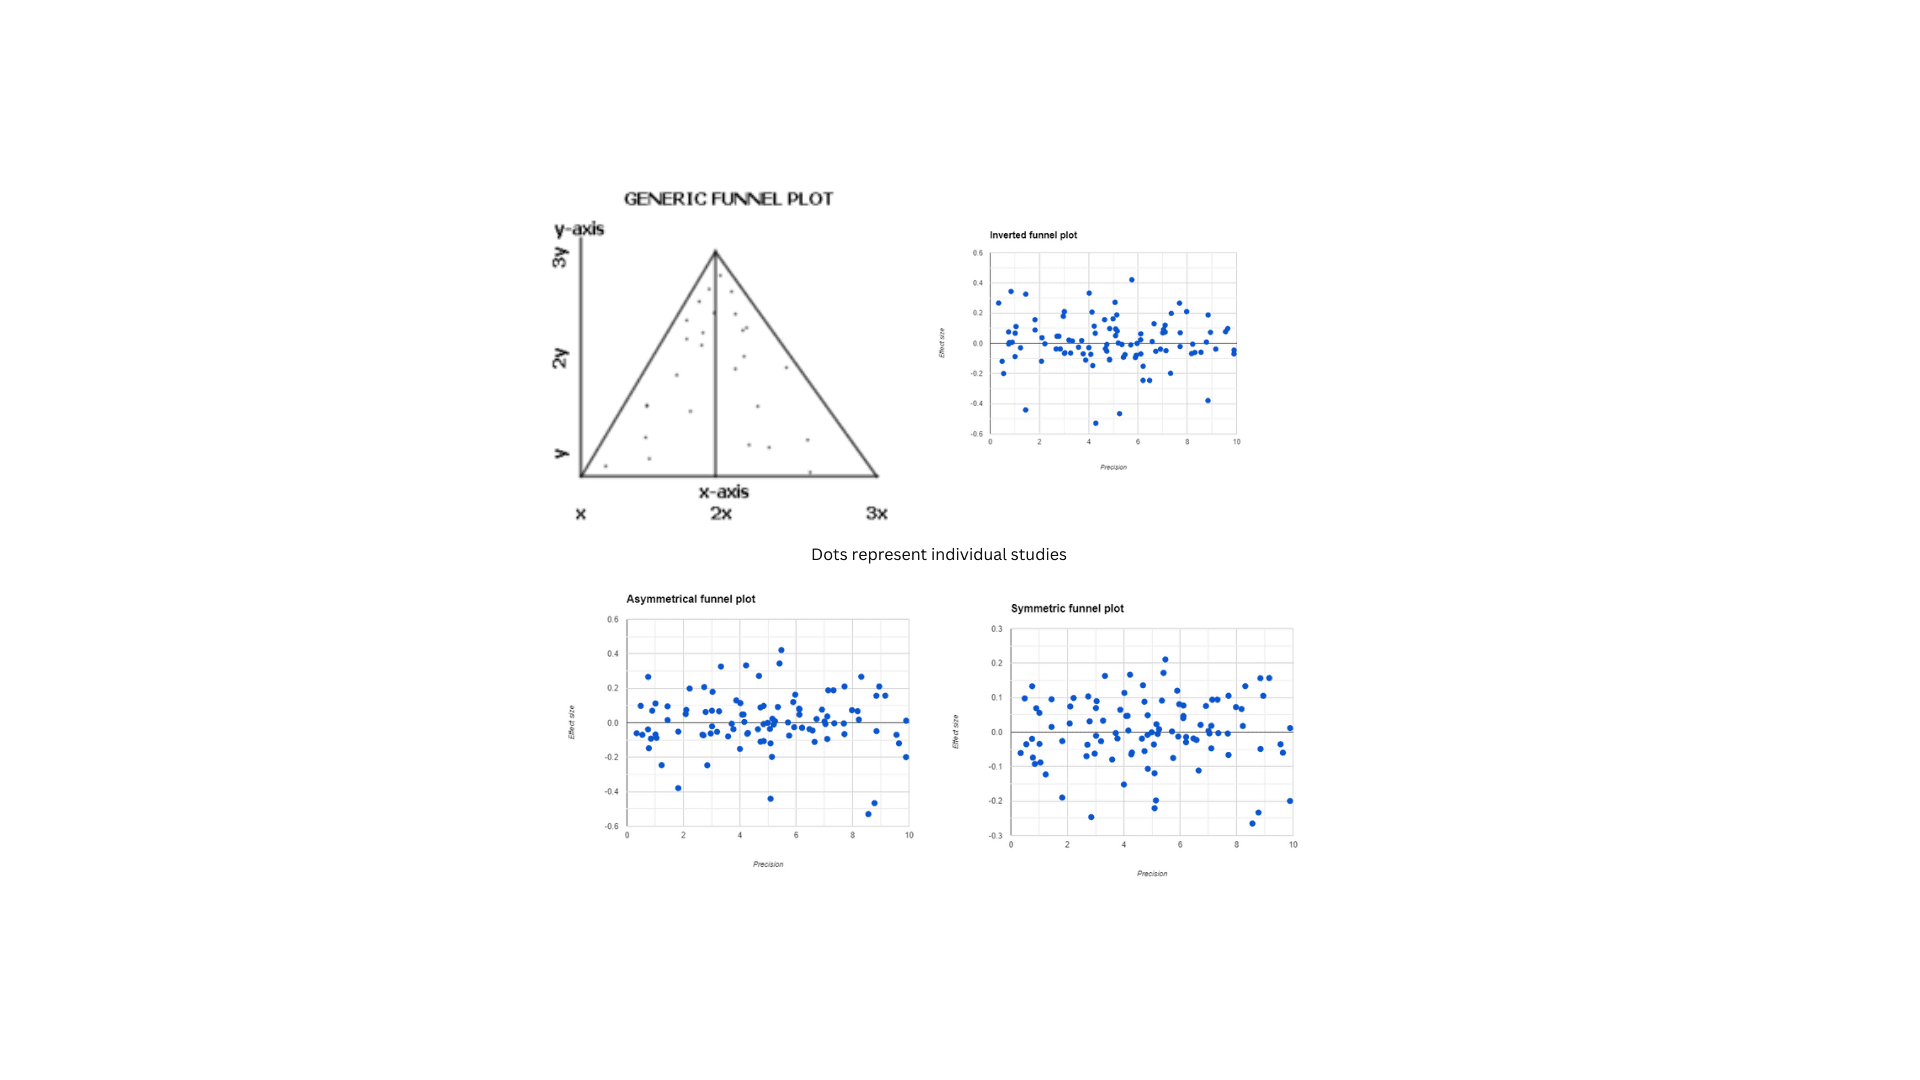
A funnel plot is used to assess the presence of publication bias or other types of bias in systematic reviews and meta-analyses.
Publication bias occurs when studies with statistically significant results are more likely to be published than studies with non-significant or inconclusive results. This can lead to an overestimation of the true effect of a treatment or intervention.
Let us understand the concept :
A funnel plot is like a graph you might see in a science class. Imagine you're looking at a dartboard where each dart is a different medical study. The darts are thrown at the dartboard that's laying flat on the ground. The horizontal line, or the ground...
Try our Free Plan to get the full article.