Download A4Medicine Mobile App
Empower Your RCGP AKT Journey: Master the MCQs with Us!

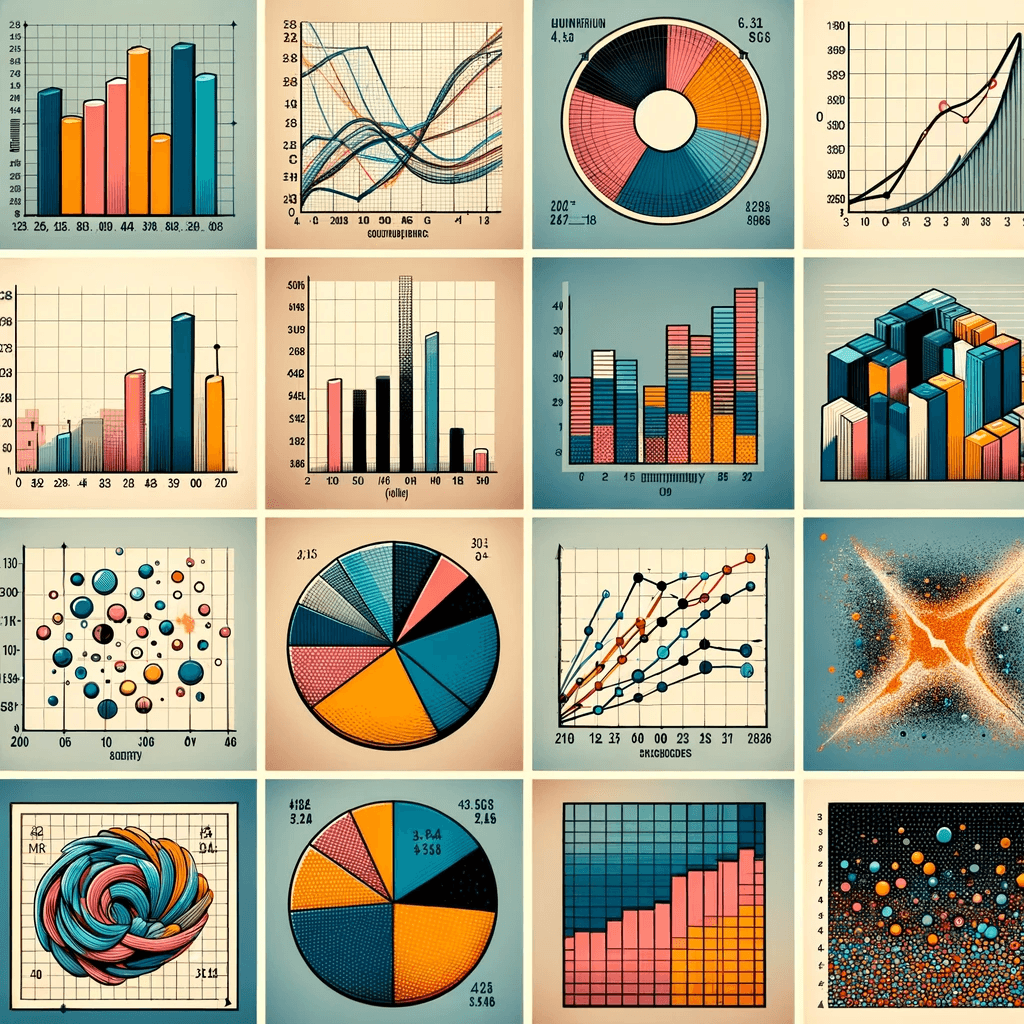
In the realm of data analysis and statistics, graphical representations play a crucial role in simplifying complex data, allowing for an easier and more effective understanding of trends, patterns, and relationships. These visual tools convert numerical data into visual formats, making the interpretation of large datasets more intuitive and accessible.
Graphical representations come in various forms, each tailored to highlight different aspects of data. For instance, bar charts and pie charts are excellent for comparing categories, while line graphs and area charts are ideal for showing trends over time. Scatter plots reveal relationships between variables, and box plots provide a concise summary of distribution characteristics. Histograms are used for depicting the frequency distribution of continuous data, and heat maps are effective in displaying complex data with variations in color.
Understanding these methods is crucial in a world increasingly driven by data. Whether in academic research, business analytics, market research, public health, or almost any field, effective data visualization helps in making informed decisions, spotting trends, and communicating findings to others. The power of these graphical tools lies not just in their ability to present data but to tell a story through numbers, making them indispensable in data-driven environments.
| Graphical Method... |
|---|
Try our Free Plan to get the full article.